

Sharing students’ course evaluations is an important element of demonstrating your teaching effectiveness in the teaching portfolio. While you should include the complete collection of your course evaluations in an appendix to the teaching portfolio, consider including a summary of your course evaluation data with a narrative that helps readers understand how you have reflected upon the data to improve your teaching effectiveness over time.
Summary chart of course evaluation (CIS) data
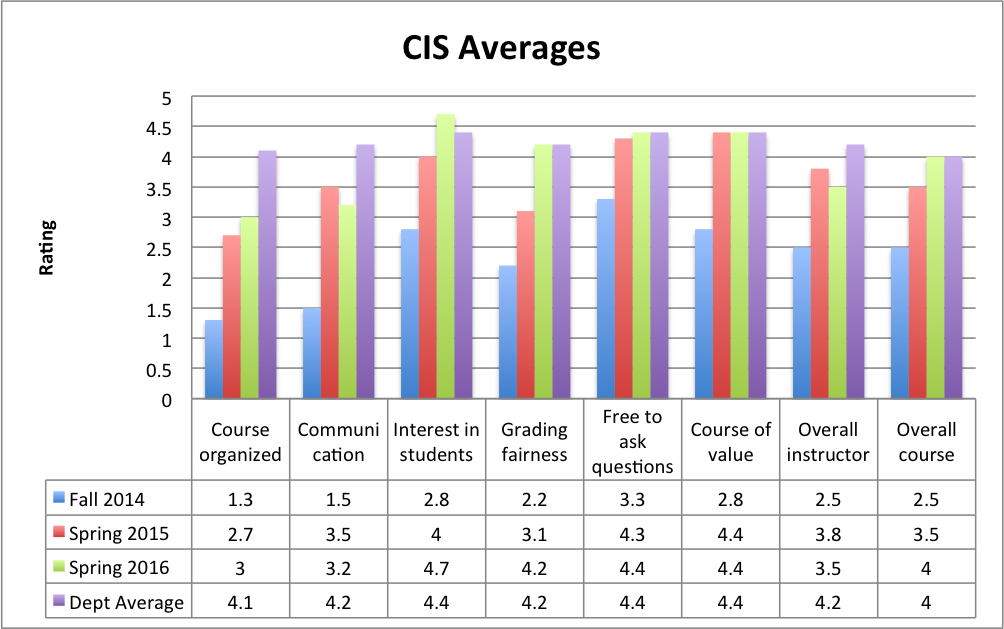
One way to create a compelling visual of your teaching progress over time is to plot that progress over several semesters. By laying out general items along a timeline, you can document trends in student evaluations (see Figure 1). If a single data point is out of line, its impact is lessened by the overview, and you may choose to discuss factors in that particular semester that could have contributed to the deviation.
Along with a visual that allows readers to quickly make sense of key aspects of your course evaluations over time, include a narrative that puts the data into context. You may mention when you have taught new courses versus repeat courses, address changes in student population (large lecture courses versus small seminars, for example), or your attempt to try new teaching techniques and how that may have impacted students’ ratings.
Sharing written comments
In addition to plotting cross-semester results, an instructor should address students’ written comments and provide an explanation of how these comments have informed teaching choices. You might arrange comments by theme that link to aspects of your teaching that you discuss in other parts of your portfolio. Don’t shy away from including a selection of comments that demonstrate both areas of strength and areas for improvement. Sharing negative comments gives you an opportunity to demonstrate how you address critical feedback and make meaningful changes to improve your teaching effectiveness.